Get Sh*t Done in Power BI
1.5 hour Short Course
If you hate overviews and need to learn fast. This is the course for you .
NON TRADITIONAL LEARNING.
Step 1: DO FIRST ASK QUESTIONS LATER!
You can get a dashboard up and running quickly without even knowing the basics in Power BI. Before learning the ends and out of the tool. Try to follow this video and make a dashboard. You can find the data set here.
Get the data set:
Make a Dashboard and Learn the Basics
in Ten Minutes!
Did you succeed at making your first dashboards? If you didn't succeed. Don't worry we are going to show you how to load data quickly and review some other steps that were highlighted in the video. If you did succeed. Slap making a Power BI dashboard down on your list of achievements.
What Should You Be Able to Do After Watching the Video?
- 1Load Data
- 2Delete Rows and Promote Headers
- 3Create Interactive Visuals
- 4Rename Columns
- 5Remove Columns
Getting Data into Power BI
There are multiple ways for you to get data into Power BI. I am not going to waste a ton of time on this because is for you to do and not simply read step by step instructions. If you need this, check out the step by step instruction video on how to load an excel file into Power BI.
Your number # 1 Way to Get Data in Power BI will be done using the Get Data Icon on your top ribbon.
Home>>Get Data
Other Ways to Get Data into Power BI
- Copy paste data into Power BI- Home Tab>>Enter Data>>Copy and Paste
- New Source Icon-Home>>Edit Queries>>New Source>> Load Data
There are scores of different data files that you can bring into Power BI. There are also quite a few data connectors. We will not cover all of them here because the goal is progress. There will be different use-case that require you to bring in different data sources.
Challenge
Try to Load the excel file before watching the video.
The data set has two tabs Load in the DC tab only from the two tabs in the excel sheet.
Watch How to Get Data into Power BI
What Should You Be Able to Do By Now?
Dirty Guide to Query Editor
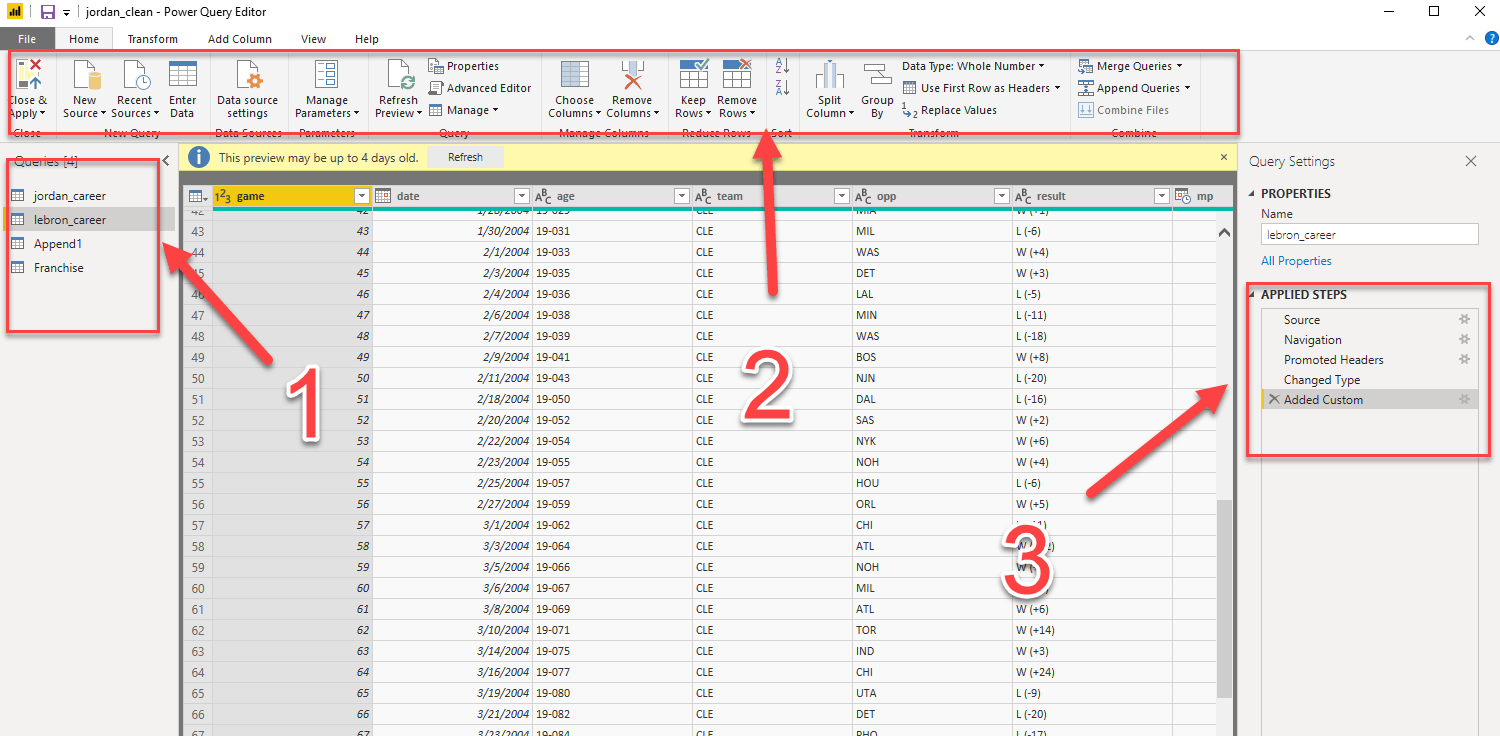
The query editor is your one stop source to transform your data. This is where you are going to build your data model prior to visualization. You can quickly access the query editor in two ways. You can click the Query Editor Icon one the Home tab. Queries are simply your data sources.
Get to the Query Editor
Home >> Edit Queries
As a beginner:
You must identify the 3 areas listed above:
1. Queries-This is where your data lives. You can click on any of these tables to interactive wit that specific table.
2. Toolbar - This is your toolbar. Most of your essential task can be complete from just the home tab.
3. The Applied Steps -The applied steps list out each step that used to shape your data into the current model. You can see that my current model has 5 steps
- Added a data source
- Navigation--this jst means that I have tables that can be selected from.
- Promoted my first rows to headers
- Change a data type
- Added a Custom Column
Essential Task to Learn in the Query Editor
1. Applied Steps
2. Change Data Types
3. Remove Duplicates
4. Delete Columns
5. Append Tables
6. Merge Tables
7. Split Columns
8. Merge Columns
9. Create Custom Columns
All of this you will master in this short course!
Create a Data Model
Create a Data Model with Merged and Appended Columns with Basketball Data
Get the data set:
Dive into the second part of this Query Editor tutorial. We will take it one step further and have you create a dashboard similar to the image one below.
Challenge 1: Create a Conditional Column
Challenge 2: Create a Jordan vs Lebron Dashboard
Quick Tour of the Report View
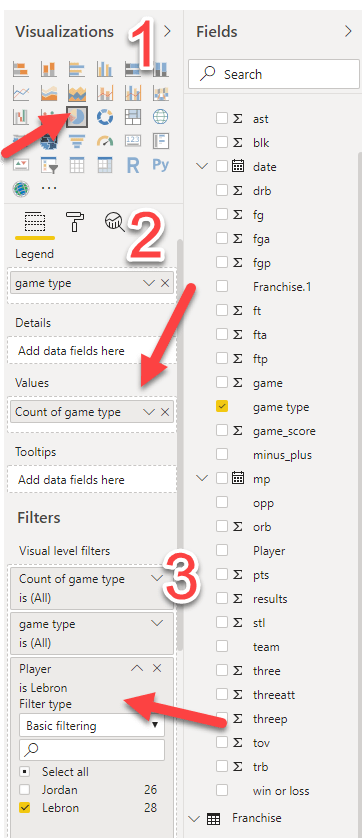
The report view give you access to the visualization panel which allows you to change different graphs. The most import thing here is not the actual graphs but which one to choose. It also allows you to create calculations.
This are the Fundamentals
1. Visualizations - Choose the specific graph you want to use.
2. Fields - This gives you the fields option.
I.e in my legend field I have game time and my values field I have count of game type.
- The paint roller gives you full access to customize your visualization.
- The magnifying glass will allow you to bring in statistics such as trend lines and constants.
3. Filters- The filters allow you to filter the visualization or place filters at the report or at the page level.
What should you learn next?
DAX
You should make sure that you master the basic calculations. So that you can bring the real insight and intelligence to your business cases. This article will highlight the Top Functions Used in Power BI. Check out our dashboard examples
Get on a 15 minute coaching call with me and together, we'll figure out the first steps for you to become, just, ridiculously productive in Power BI.


