Filter Data with Python Query

I believe there a several Python functions that every data analyst should learn. VALUE_COUNTS, GROUPBY and QUERY is also on the list. Of course all these are part of the PANDAS library. So Let’s explore the query function. This function allows for filtering data frames using a concise and readable syntax. What is the basic […]
3 Ways to Calculate Percent Change in Python
Percent change using Pandas is one of the easiest ways to get the percent change formula. This can be done with a single line of code. However, you will need to use a data frame from the Pandas package to do this. I will show you multiple ways to calculate percent change with ease. Do […]
What is Pandas in Python -2023?
Pandas is one of the most popular and essential libraries in the Python ecosystem, especially when it comes to data analysis and manipulation. With its expressive syntax, versatile functionality, and ability to handle vast amounts of data, Pandas has become the go-to tool for data scientists, analysts, and developers alike. It is an absolute MUST […]
Calculate Percent in Pandas Pivot Table
Pandas is a powerful Python library for data manipulation and analysis, and one of its most useful features is the ability to create pivot tables. Pivot tables can help you summarize and analyze large datasets quickly and efficiently, and Pandas makes it easy to create them using the pivot_table() function. You can check out the […]
How to View the First N Rows in a Pandas Data Frame
When working with huge datasets, it is often helpful to review the first few rows of the data rapidly in order to get a concept of what the data looks like. There are three straightforward ways available in Pandas for accomplishing this goal: the head approach, slicing, and indexing. In this article, we will discuss […]
Cohort Analysis with Python
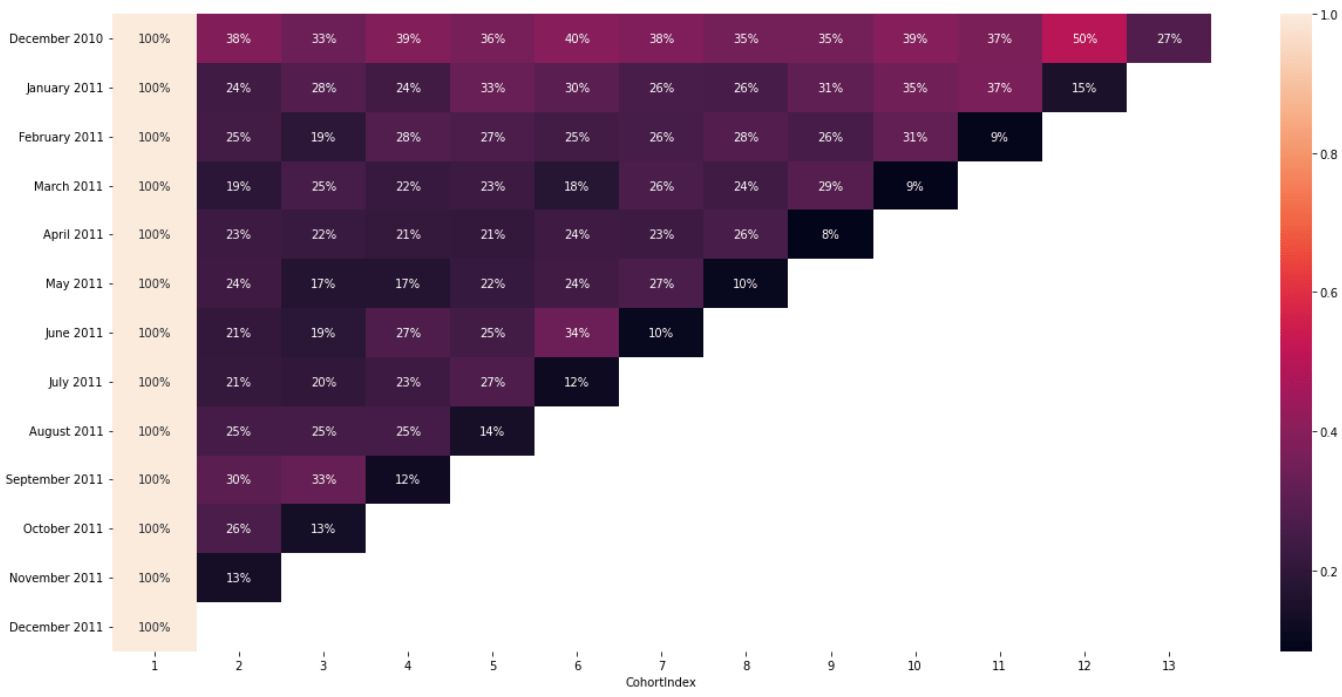
Using Python to understand user retention is much easier than you might have imagined. All of this can be done with a few libraries. For this tutorial, we will be using Pandas, Matplotlib and Seaborn and Datetime. You can follow the along in the video to save time if you are in a rush. You […]
Pandas Crosstab
Let’s talk about how to do some bi-variate analysis using the Crosstab function from pandas. The Crosstab function is very flexible and allows us to compare two categories. As usual, we’ll work on this practically using a sample dataset. We’re going to analyze a BankChurn dataset to see when our customers left and the different categories […]
Pandas Group By Function
Grouping data is one of the most important skills that you would require as a data analyst. Luckily, Pandas has a great function called GroupBy which is extremely flexible and allows you to answer many questions with just one line of code. In this tutorial, we’re going to understand the GroupBy function and subsequently answer […]
Python Data Science Interview Questions and Answers
Honestly, knowing Python and knowing how to answer interview questions with Python can be two separate skills. I have bombed interviews due to not explaining my thought process when approaching a problem. Often interviewers are not concerned that you arrive at a perfect answer in the limited time that you are given. They put more […]
Python Moving Average
Creating a moving average is a fundamental part of data analysis. You can easily create moving averages with Python data manipulation package. Pandas has a great function that will allow you to quickly produce a moving average based on the window you define. This window can be defined by the periods or the rows of […]