Global Video Game Sales and Meta Critic Scores
Take a Look At Mario Vs Zelda Visualization
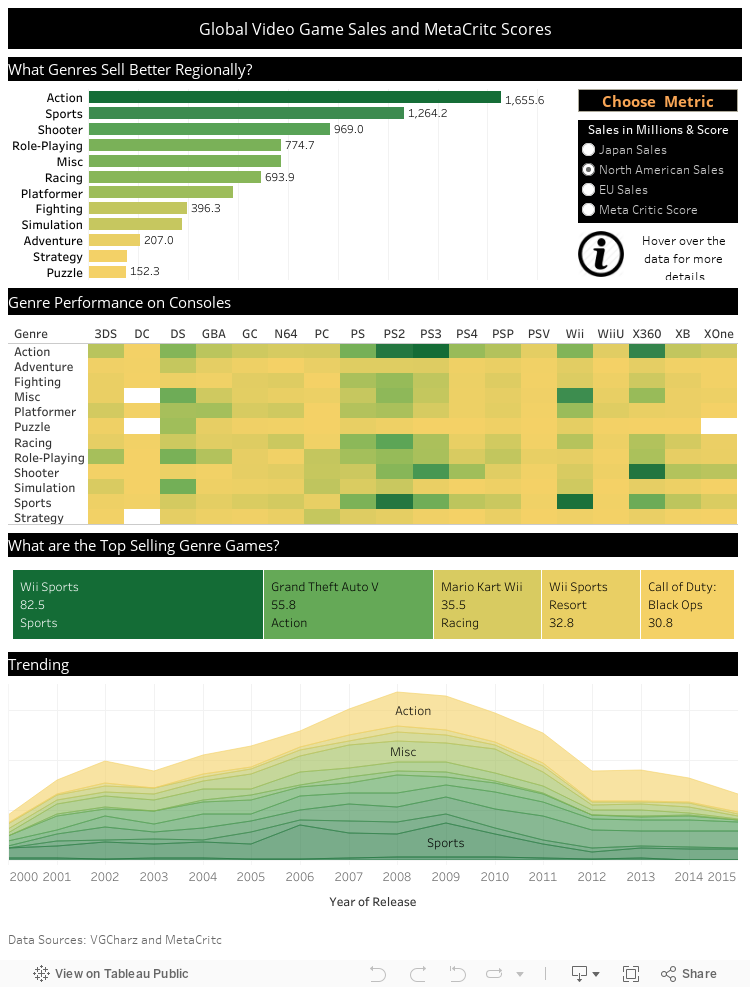
This data is sourced from VGchartz and MetaCritc. The data is segment global in Japanese, European Union, and North American. This is sales data in the millions from VGchartz. There were a few answers that I wanted to answer using the data set. Global video games hit an all time high of 910 dollars in 2016. However, what genre performed better in different regions around the world was also present in the data.
How I built this visualization?
This visualization was built by importing a CSV into Tableau. There were several sheets that made up the dashboard. However,I will just focus on the visualizations.
Parameter Control
The first task was to built a parameter control in order to allow the user to switch between the measure of regional sales and Metacritc scores. I used simple case calculation to be able to switch the measures using the calculated field. I name this calculated filed Measure.
Bar Graph
A simple bar graph was made by places Genre on the rows and the Measure on columns shelf. I put Measure on the color shelf and switch to gold and green.

Heat Map
I created the heat map by using the Console dimension in the columns and Measure on rows. This created a table. Change to marks type to squares and to get the color formatting drag measure on to color.

Trending
To create the Trending view, drag the Year of Release to columns and Measure to rows. The visual was changed to polygons. Color was formatted with the Measure being put on color shelf and changed to gold and green.

Lastly, this was all placed into a dashboard.