How to Add a Filter in Excel
Adding filters in Excel is a fundamental skill that enhances the tool’s utility, allowing users to efficiently sort through and find specific data within large datasets. Using filters in Excel is like putting on special glasses that help you see exactly what you’re looking for in a big pile of information. Whether you’re organizing a bunch of stuff, checking out survey answers, or just keeping tabs on your spending, filters make it easy to find what you need. They help you pick out the important bits so you can make decisions faster and with less hassle.
Excel filters are used to:
- Organize data: Makes long lists more manageable by showing only the items that meet your criteria.
- Analyze data: Helps spot trends and patterns in a sea of numbers.
- Simplify searches: Quickly finds specific information in a large dataset.
- Enhance productivity: Saves time by displaying only the relevant data you need to work with.
- Prepare reports: Creates focused reports by showing only data that’s relevant to a specific topic or audience.
- Improve decision-making: Allows for quicker comparisons and better decisions by isolating data points that matter most.
How to Add a Filter in Excel: Step-by-Step
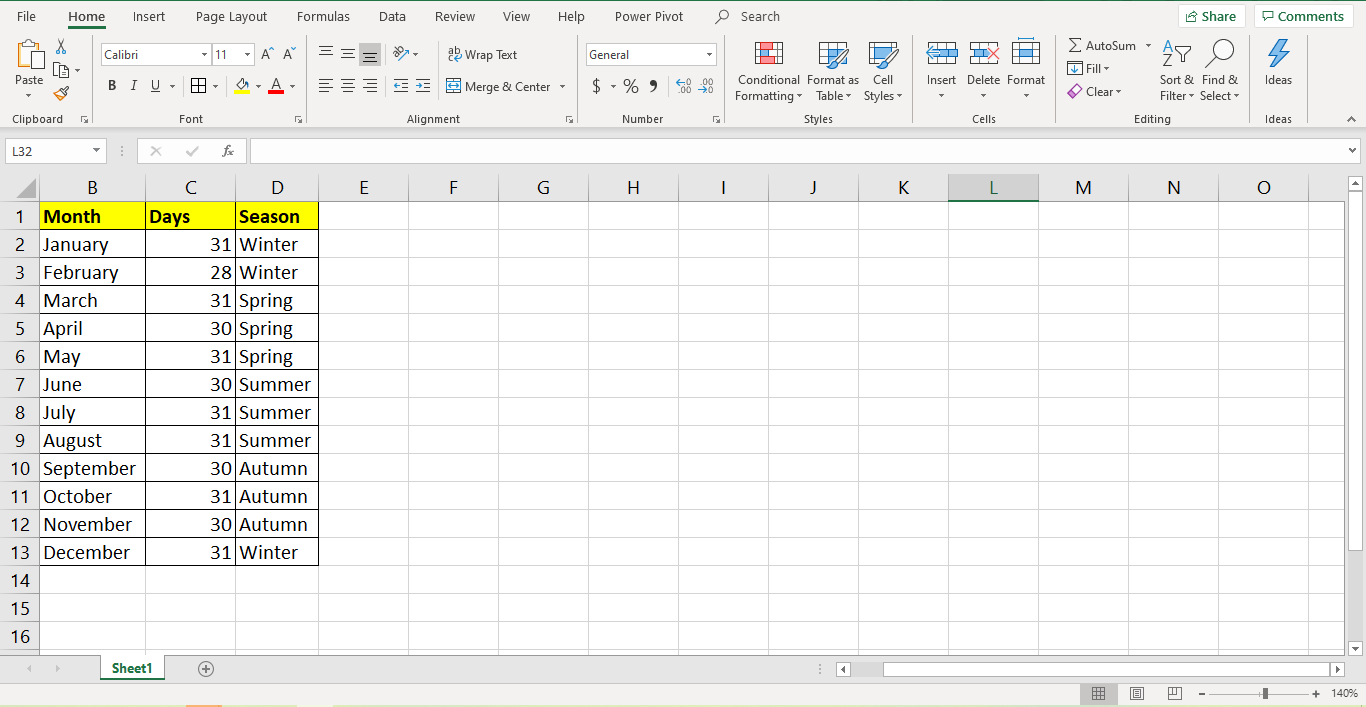
The table below serves as an example and provides a clear and simple overview of the months of the year, neatly organized into four columns. Each row represents one month, with the columns displaying:
No.: The order number of the month in the year, from 1 to 12.
Month: The name of each month, starting with January and ending with December.
Days: The number of days in that particular month, showing us that most months have 31 days, a couple have 30, and February uniquely has 28.
Season: The season associated with each month, grouping the months into Winter, Spring, Summer, and Autumn.
This table is a perfect example to demonstrate how to add filters in Excel, as it has distinct categories that can be sorted or narrowed down. Let’s get right into it!
Step 1: Open Your Excel Spreadsheet
First, launch Excel and open the spreadsheet where you want to apply the filter.
Step 2: Select Your Data
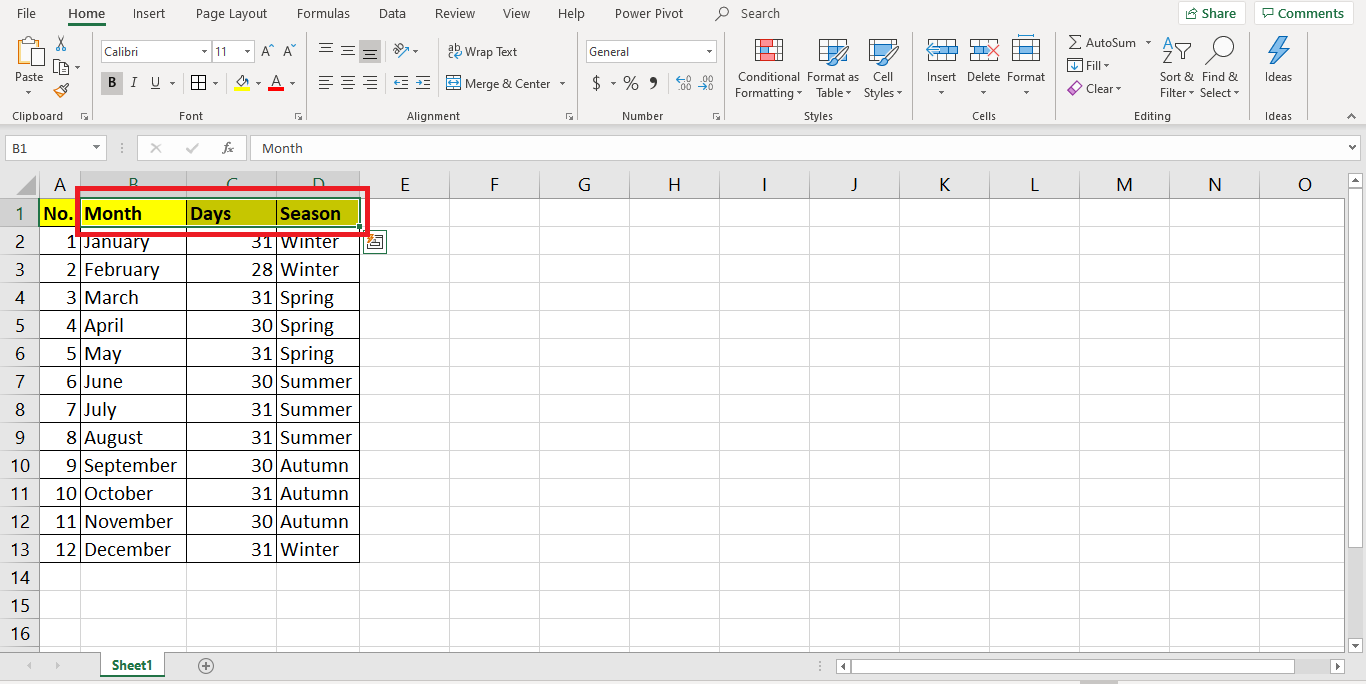
Click on the cell at the top of the column that you want to filter. If you wish to apply filters to multiple columns, drag your mouse to select the top cells of all columns you’re interested in.
Note: The first thing to do, if you want to add a filter function in a table, you need to use the headers to select columns in which you want to apply the filters.
Let us select the headers “Month”, “Days”, and “Season” now.
Step 3: Access the Filter Option
Navigate to the “Data” tab on the Excel ribbon. Look for the “Sort & Filter” group and select the “Filter” option.
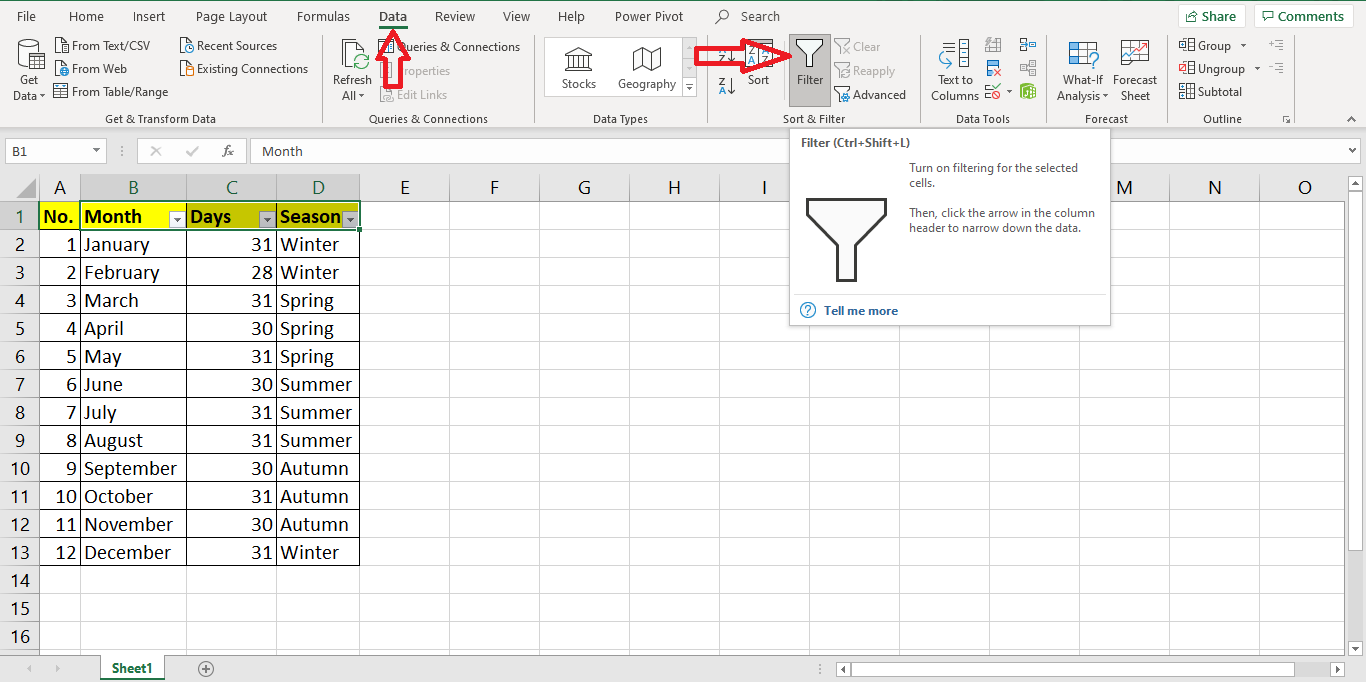
Step 4: Apply Your Filter
After clicking “Filter,” you’ll notice drop-down arrows (or button) appear at the top of each selected column.
Now it’s time to take a step forward and try out the filter we have just created in practice.
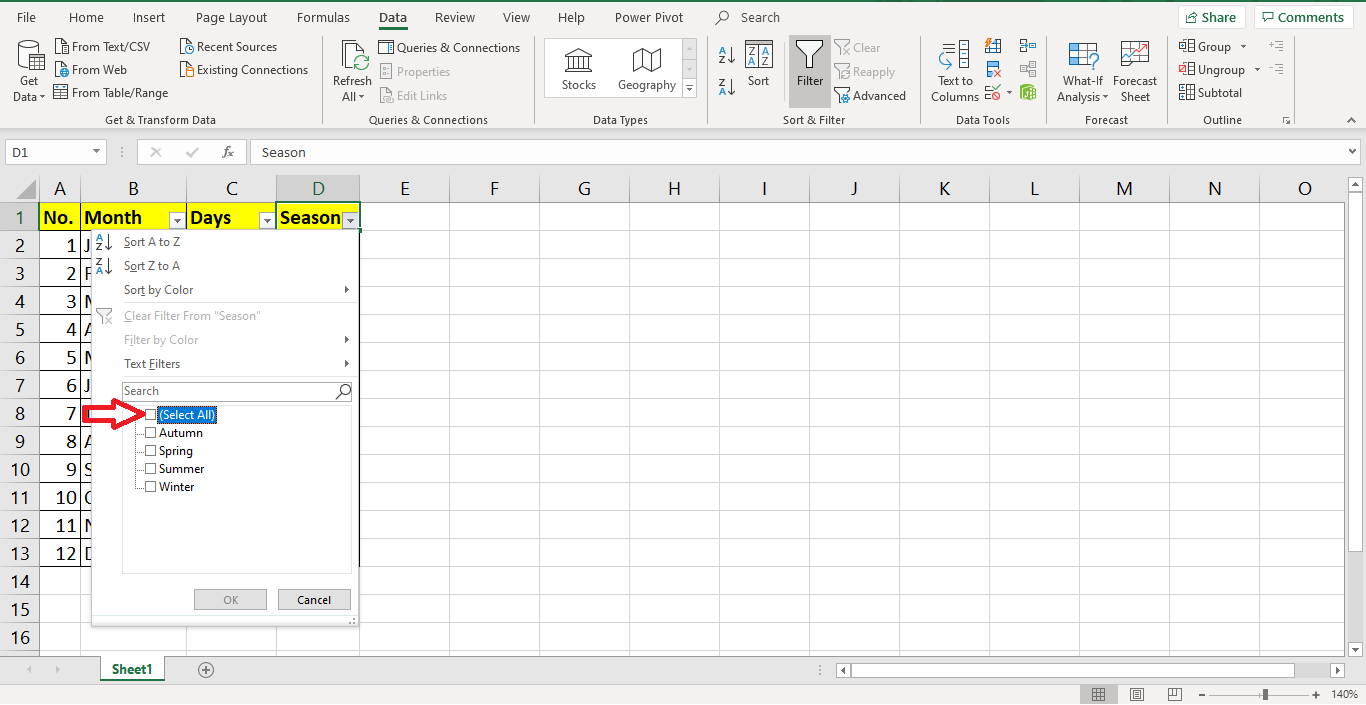
Let’s say we want to filter out only the summer months. Click on the drop down arrow in the column “Season”. All of the options are selected by default.
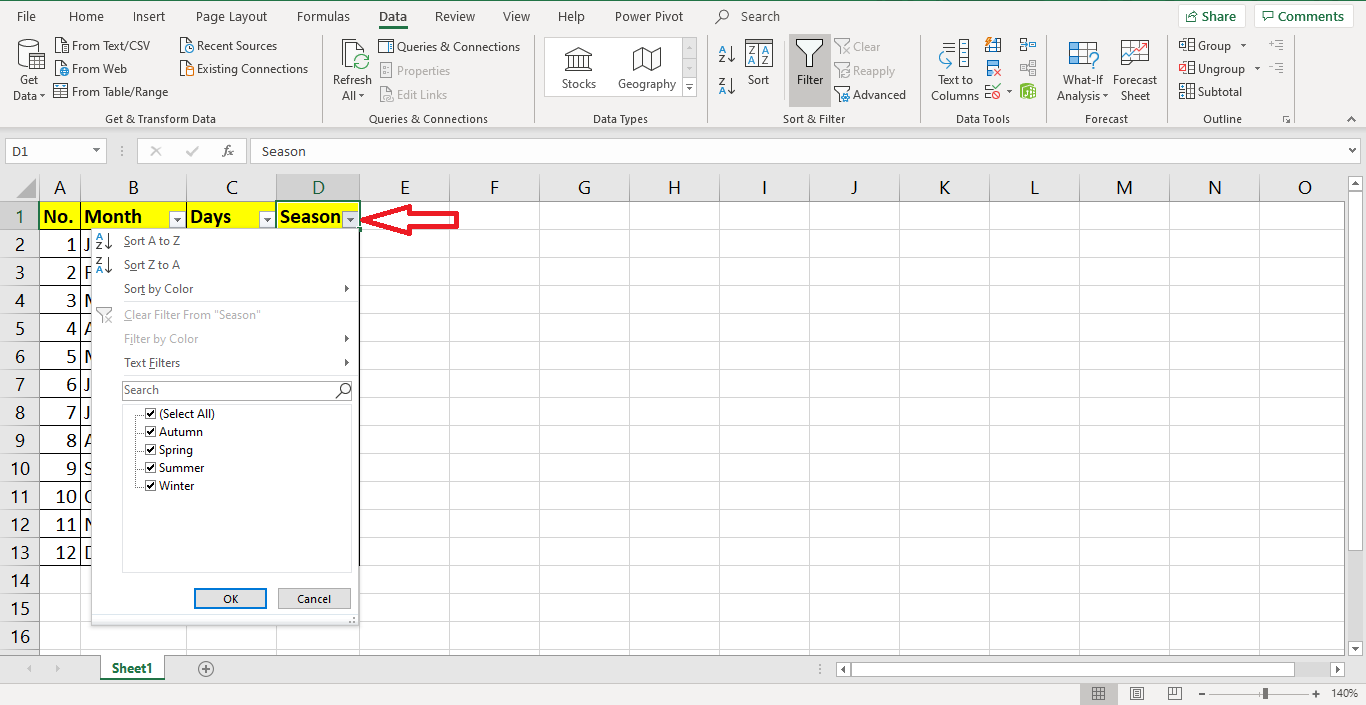
Step 5: Customize Your Filter
Choose your desired filters by selecting or deselecting the check boxes next to each item. Excel will automatically update the spreadsheet to display only the rows that meet your criteria.
Note: Unselect the options by clicking on “Select All”.
Now tick the box next to the option which we want to filter out, which is “Summer”.
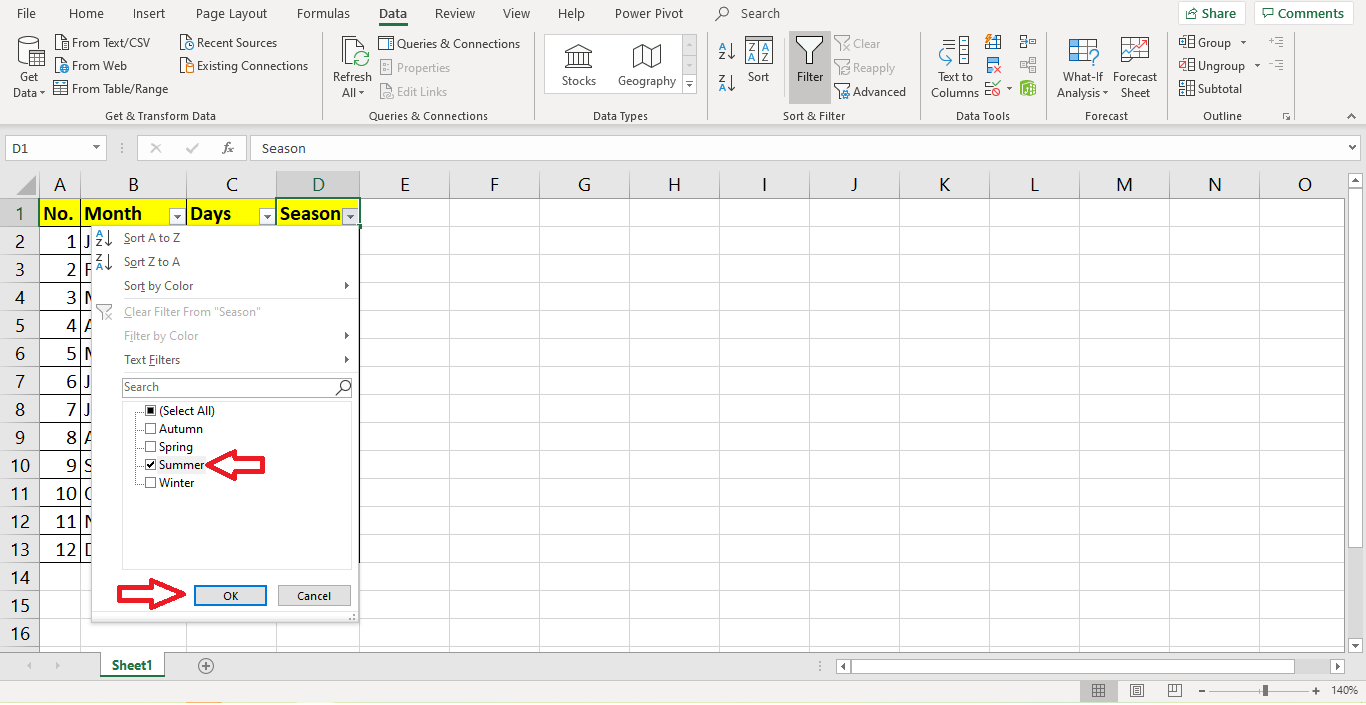
Confirm with OK and you will see that only the “Summer” months are now displayed in the table.
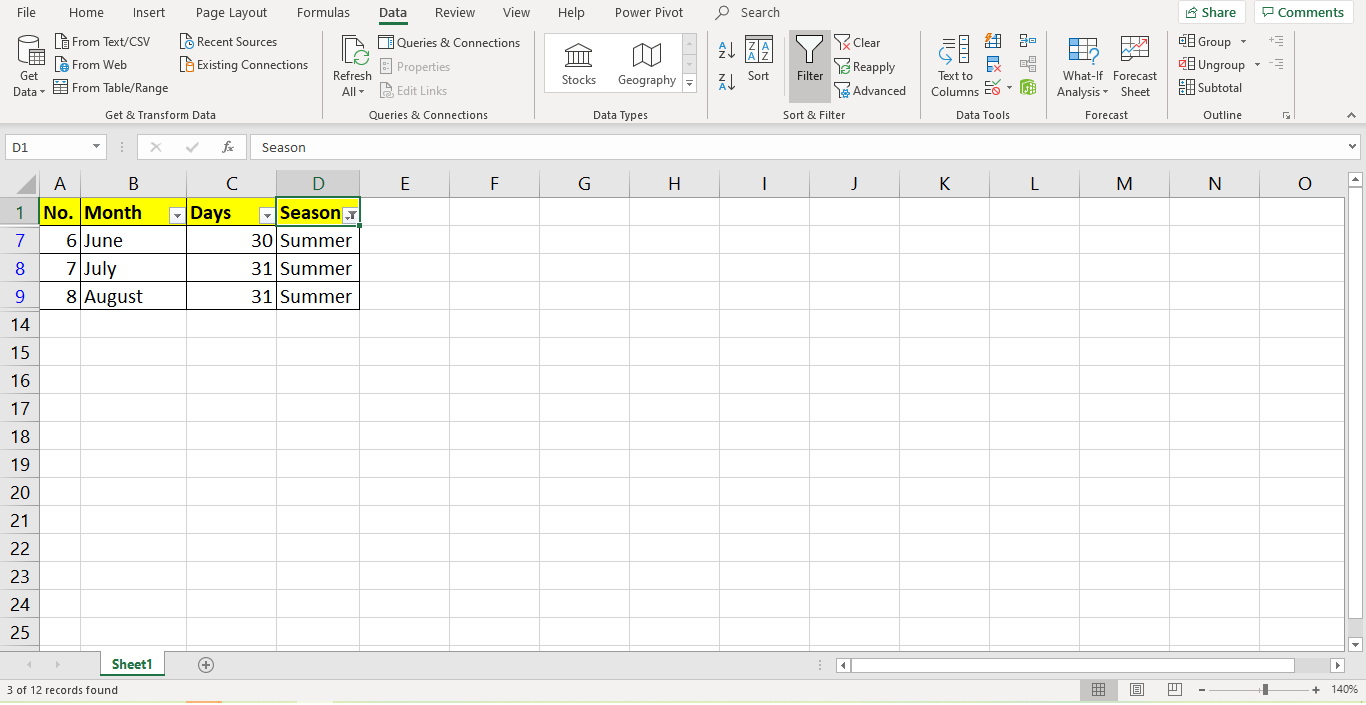
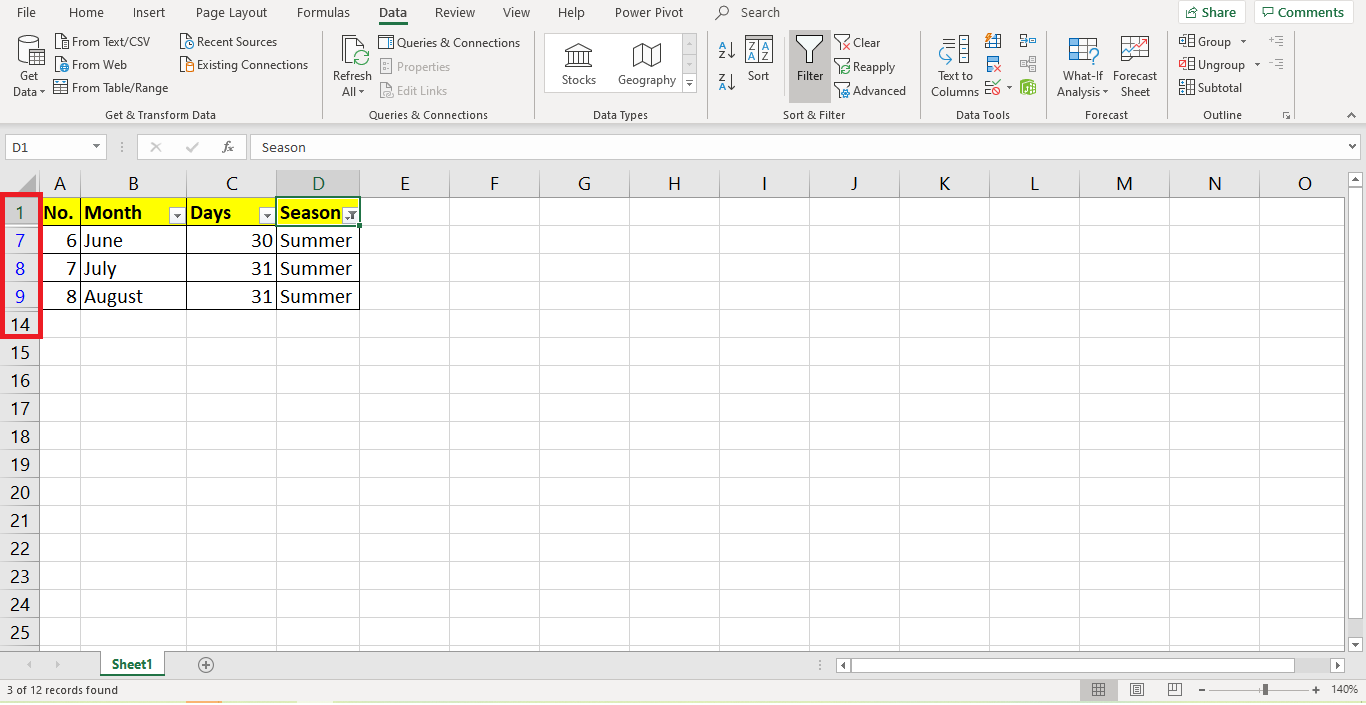
Note: If you have a look at row numbers, you’ll see that the rows with data for other months have not been deleted. They are only Hidden.
Excel filters are most likely used by:
- Business Analysts: To sift through sales, financial, or operational data.
- Marketers: For segmenting customer information and campaign results.
- Educators: To manage student grades and attendance records.
- Project Managers: For tracking project timelines and resource allocation.
- Human Resources Professionals: To organize employee details like salaries and performance ratings.
- Researchers: When analyzing survey data or experimental results.
- Healthcare Professionals: For patient records and medical data management.
- Financial Experts: To work with investment portfolios, expense tracking, and budgeting.
- Administrative Staff: For scheduling, inventory, and general data organization.
- Anyone with Data Needs: Really, anyone who works with data in tables can use filters to work more effectively.