Tableau Table Calculations
In Tableau, a user can perform a different type of computations using table calculations. For example, using table calculations user can calculate the running total of sales or the percent of total profit across countries etc.
Summary/ Objective:
In this article, I am going to brief about different table calculation functions and their uses in Tableau.
FIRST
FIRST() : It returns the number of rows from the current row according to the partition dimensions specified by the user
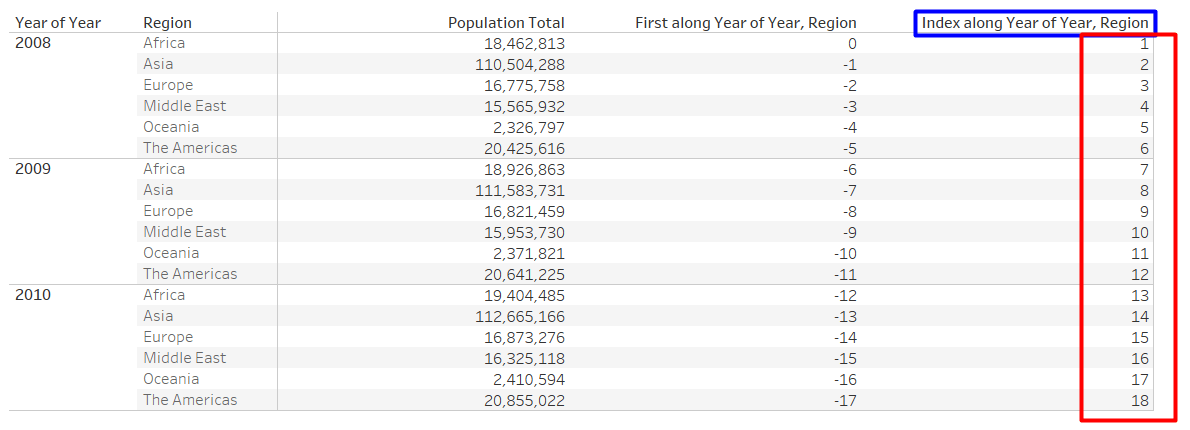
Example: The below snapshot shows the yearly population across regions. When FIRST() is being calculated with respect to “Year” and “Region” the offset of the first row from the second row is -1

INDEX
INDEX() : INDEX function, returns the row number according to the partition dimensions specified by the user
Example: When INDEX() is being calculated across “Year” and “Region”, the values returned are 1, 2, 3, … etc.
LAST
LAST() : It returns the number of rows from the current row to the last row according to the partition dimensions specified by the user
Example: The below snapshot shows the yearly population across regions. When LAST() is being calculated with respect to “Year” and “Region” the offset of last row from second row is 16

LOOKUP
LOOKUP() : LOOKUP() is an important table calculation function. It returns the value of the specified expression in a “target row”.
“target row” is specified as a relative position of the row from the current row. FIRST() + n or LAST() – n, can be used as to specify the target row relative to first/last rows in the partition dimensions.
Expression: LOOKUP(expression , [offset])
Example: The below snapshot shows the yearly population across regions. When LOOKUP(AVG[Population],2]) is being calculated with respect to “Year” and “Region”, each row shows the value of the next two year and region

RANK
RANK() : It returns the standard rank of the dimension corresponding to the given measure. If there are identical values, then same rank is assigned with gaps inserted into the number sequence
Expression: RANK(expression , [‘asc’|’dsc’])
‘asc’ : This argument is used to rank the values in ascending order
‘dsc’ : This argument is used to rank the values in descending order
By default, RANK function takes descending order
Example: For example, let say there are Regions = {A, B, C, D, E} and respective Sales in Regions = {$400, $200, $400, $250, $400}
Now, if we calculate RANK() across Regions the output value would be {1,5,1,4,1}.
The same value is being assigned same rank and gaps are inserted into the number as next rank after 1 is 4.
RANK_DENSE() : It returns the dense rank of the dimension corresponding to the given measure. If there are identical values, then same rank is assigned but no gaps are inserted into the number sequence
Expression: RANK_DENSE(expression, [‘asc’|’dsc’])
‘asc’ : This argument is used to rank the values in ascending order
‘dsc’ : This argument is used to rank the values in descending order
By default, RANK function takes descending order
Example: For example, let say there are Regions = {A, B, C, D, E} and respective Sales in Regions = {$400, $200, $400, $250, $400}
Now, if we calculate RANK_DENSE() across Regions the output value would be {1,3,1,2,1}.
The same value is being assigned the same rank and no gaps are inserted into a number as next rank after 1 is 2.
RANK_UNIQUE() : It returns the unique rank of the dimension corresponding to the given measure. Identical values are assigned different ranks.
Expression: RANK_UNIQUE(expression, [‘asc’|’dsc’])
‘asc’ : This argument is used to rank the values in ascending order
‘dsc’ : This argument is used to rank the values in descending order
By default, the RANK function takes descending order
Example: For example, let say there are Regions = {A, B, C, D, E} and respective Sales in Regions = {$400, $200, $400, $250, $400}
Now, if we calculate RANK_UNIQUE() across Regions the output value would be {1,5,2,4,3}.
RUNNING SUM
RUNNING_SUM(): As the name suggests, it returns the running sum value from the first row to the current row according to partition dimensions specified by the user
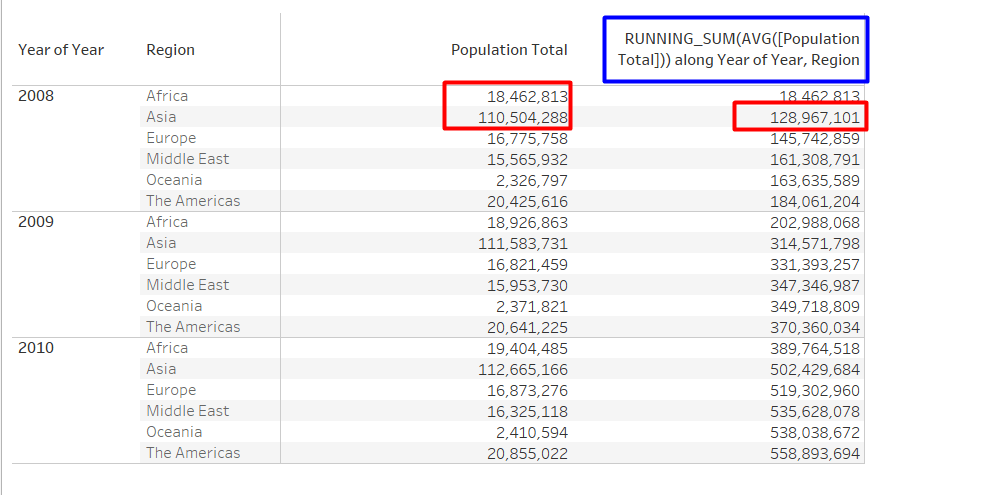
Example: The below snapshot shows the yearly population across regions. When RUNNING_SUM(AVG[Population]) is being calculated with respect to “Year” and “Region”, it returns the aggregated value of from first row to current row
Above, the value in 2nd row of RUNNING_SUM(AVG[Population]) is addition of first two rows value i.e. 18,462,813 + 110,504,288 = 128,967,101
RUNNING AVERAGE
RUNNING_AVG(): It returns the running average value from the first row to the current row according to partition dimensions specified by the user
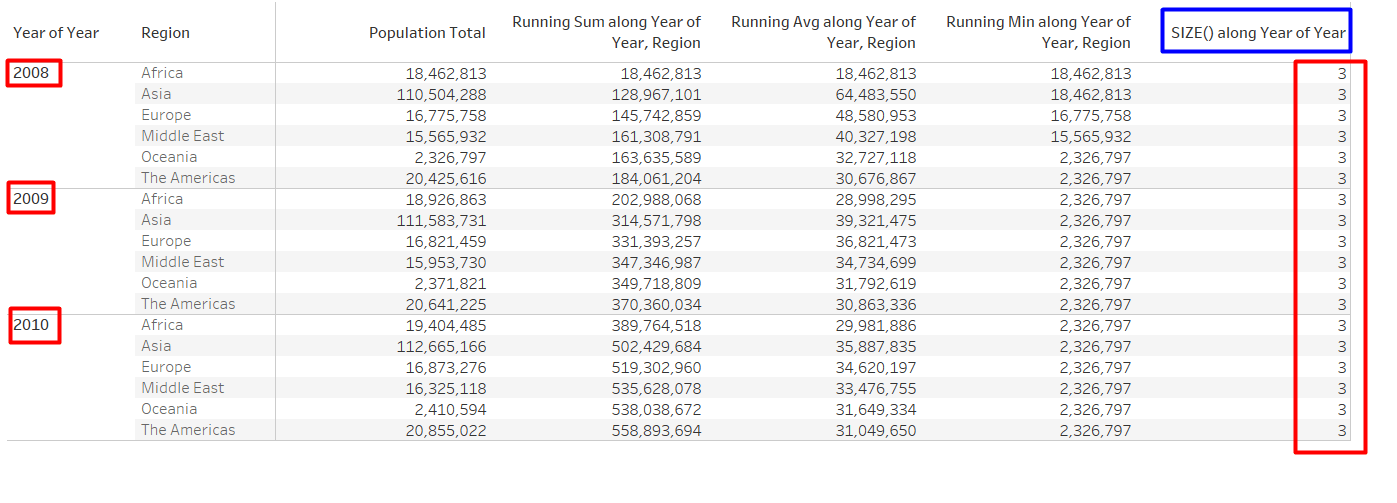
Example: When RUNNING_AVG(AVG[Population]) is being calculated with respect to “Year” and “Region”, it returns the aggregated average value of from the first row to current row
Above, the value in 2nd row of RUNNING_AVG(AVG[Population]) is average of first two rows value i.e. (18,462,813 + 110,504,288)/2 = 64,483,550

RUNNING MIN & MAX
RUNNING_MIN/MAX(): It returns the running minimum/maximum value from the first row to the current row according to partition dimensions specified by the user
Example: When RUNNING_MIN(AVG[Population]) is being calculated with respect to “Year” and “Region”, it returns the minimum value of from first row to current row
Above, the value in 2nd row of RUNNING_MIN(AVG[Population]) is minimum of first two rows value i.e. MIN(18462813 , 110504288) = 18462813

SIZE
SIZE() : It returns the number of rows within partition dimensions specified by the user
Example: The below snapshot shows the yearly population across regions. When SIZE() is being calculated with respect to only “Year”, it returns the total number of “Year” value present in the view
TOTAL
TOTAL() : It returns the total of the given expression across the partition dimensions specified by the user
Example: When TOTAL(SUM[Population]) is being calculated with respect to “Year” and “Region”, it returns the total sum of all “Population” values in each row
