Differences in Video Game Meta Critic and Users Scores
This data set is one of my favorites. Being a big fan of video games, I am always eager to explore data centered around the industry I wanted to analyze data around average critic and user scores from MetaCritic. There is often a great dependency in the numbers. So, this interactive dashboard allows you to explore the data in detail and answer some of the burning question you may have.
How I created this Visualization:
Scatter Plot
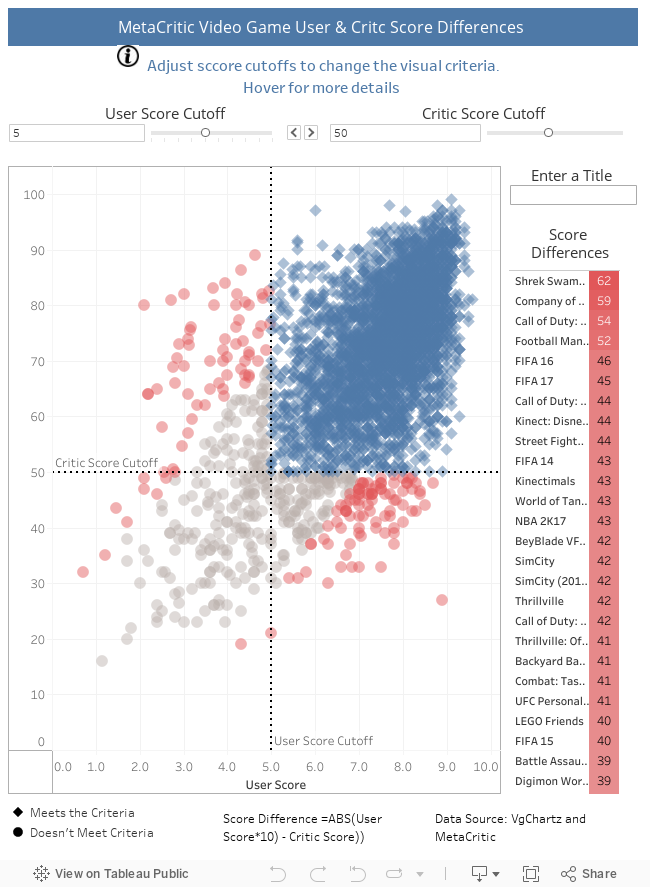
The scatter plot was created using the User and Critic Scores dimension These metrics were place on rows and columns. The level of granularity was the title of the video games. So the Name dimension was place on the shelf. This is the only visualization on the dashboard. However, a lot of interactivity was built in using parameters and sets.
Sets
There were several sets built based on the Name dimension for the level of granularity. One set was built with the dimension User Scores and another for Critic Scores. These sets were then combined into one set. Parameters were created with ranges so that the dashboard user could alter the visualization . The conditions were changed in the set to display data greater results than the cutoff parameters. The sets were dragged on to colors and shapes and altered to show diamonds falling within the parameter cutoffs and circles out of the parameter cutoffs.
Calculated Field
To created the delta in score differences for the table. The user scores needed to be normalized to the critic scores. So, the formula below was used:
ABS(AVG(User Score)-AVG(Critic Score)
This calculated field was dropped into color and changed to red. The field was also used to create the table. Table color was switched to red and squares were used to create the color. A filter was added with a wildcard function. All this was placed in a dashboard. References lines were attached to both parameters.