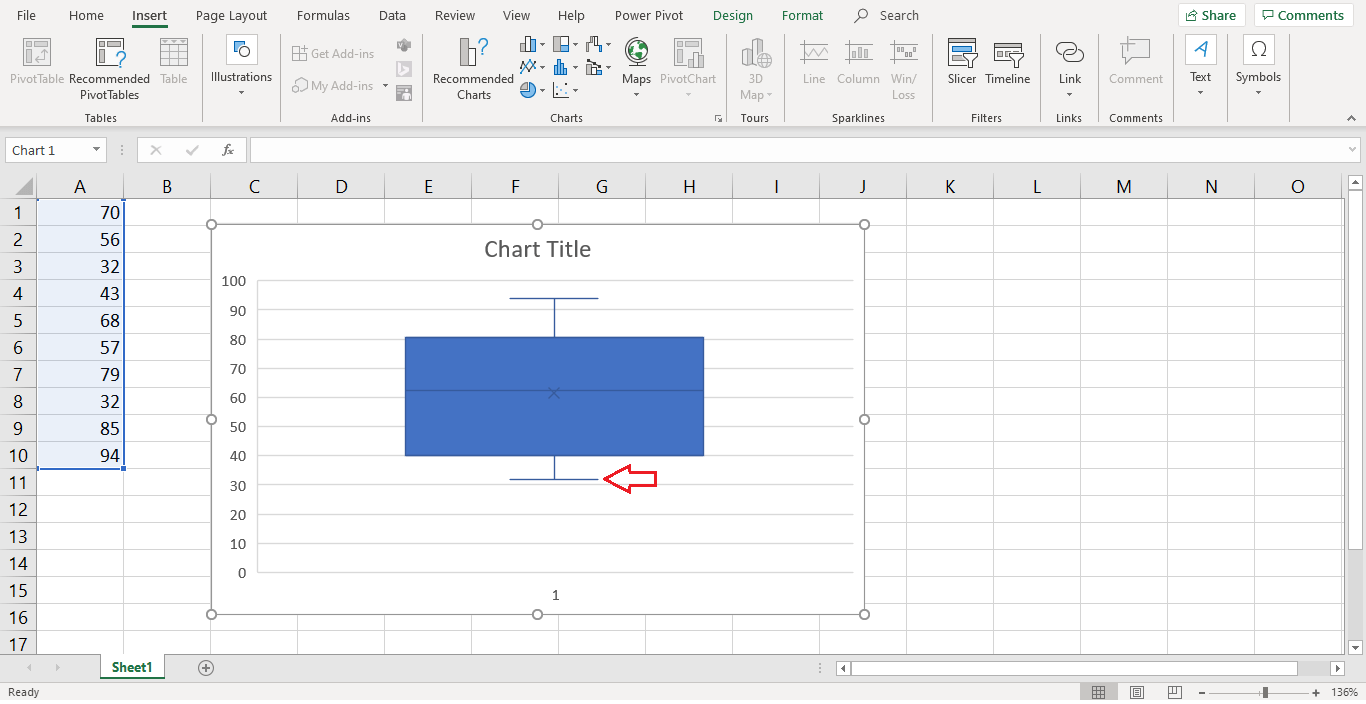
image-7 This first step is to create a visual using Excel graphs that will summarize your data into quartiles and box and whisker plots