Excel Users Intro into Python
Data Science can be an incredibly daunting venture to undertake. As time continues, what constitutes data science morphs and changes. However, in a scientist is someone who uses a proven logical method to understanding and ascribe meaning to unknown phenomena. A data science doesn’t have a physical library, pipets, test tubes. They have a collection of digital tools that help them uncover meaning in data.
One of the most important tools ever created when dealing with data is a spreadsheet. As tools advance, this tool, specifically Excel dominates in terms of usage by any professional in the data field. As great as that tool is. It has its limitations. This course is going to bridge the gap between the worlds of Excel and Python. Making you a more powerful analyst.
What you will Learn in this Tutorial
- Load Analysis Libraries
- Load data into a Data Frame
- Use descriptive statistics
- Filter data
- Create a Pivot Table
Watch the Video Tutorial
Concepts you Should Know
Excel Tables = Data Frames
- Dataframes are 2 dimensional array that contains rows and columns. I hope this sounds like an Excel Spreadsheet table. On the whole, each column is a variable and each row is an observation of that feature. The more you get into machine learning. The more you will identify with data in this way.
- Python list are Excel arrays
Since we are talking about Excel tables the first order of business is to move your excel sheet into Python. To work with python you will need an IDE which is an independent development environment. This is simply a digital notebook or application that allows your to write code. My favorites are Jupyter Notebook and Spyder.
The number one package for data analysis, spreadsheet like functions is Pandas. Pandas will allow us to do everything that you do in Excel and also make you a awesome data science practitioner. Lets dive in to learning how to load Pandas into your IDE so that you can start with some Python coding Load your IDE. Use the script to pull int your excel notebook using Pandas. If you haven’t loaded Python, use the Anaconda Installation Instructions.
Importing
In Python, we import libraries. These libraries have functions. We will be using Pandas. So we use the Import command. This command loads the Pandas library into your IDE and saves it as a variable called “pd” . This means when you are writing Pandas function. They will begin with pd. Our first function is going to use the Pandas function called read_excel to bring in your excel document. Function are similar to what you will find in Excel. A function has the name and arguments. Think for read_excel function, there is only what argument in a function. The only argument is the path to find your excel file.
Documenting
# are used to document code. Documenting your code is just a way to explain to the reader what you are doing.
Load Your Spreadsheet with Python
Lets get started with getting your data into your Python Notebook. We can achieve this by importing our data file. We are going to use the Avocado.csv file.
#The # will be used to document our code. #Import your Pandas Library and save it as the variable pd. Import pandas as pd#Lets load in our data set and save it as the variable datadata = pd.read_csv(‘avocado.csv’)
Check your Data with Data Functions
Now that our data is loaded we can do a lot of different things by using your data frame functions. We can add functions to our data frame by simply using data.functions() format.
head()
shows you the top of the data frame
tail()
shows the bottom of the data frame
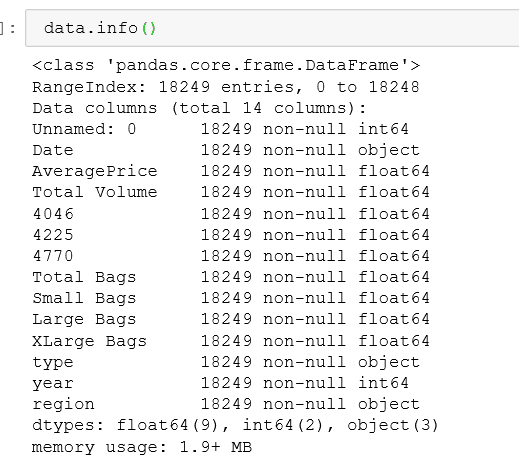
info()
get a summary of the data frame and data types
describe()
get summary statistics of the data frame


