Google Career Listings Visualization
The data was sourced from Kaggle where a user scraped the Google’s careers. Natural Language Toolkit was used in Python. NLTK and BeautifulSoup were used to clean the dataset and split the twelve hundred plus job listings. The job listings were tokenized into nearly seventy-five thousands words. The stop words were removed from the list of words. Additionally, all punctuation and HTML was removed from the comments. A list of programming languages was used to create a dictionary to identify each instances of the programming languages to get a frequency distribution. A search was made to identify the programming languages based on the dictionary built. The parts of speach tagging in NLTK allowed adjectives, nouns and verbs to be identified from the word list.
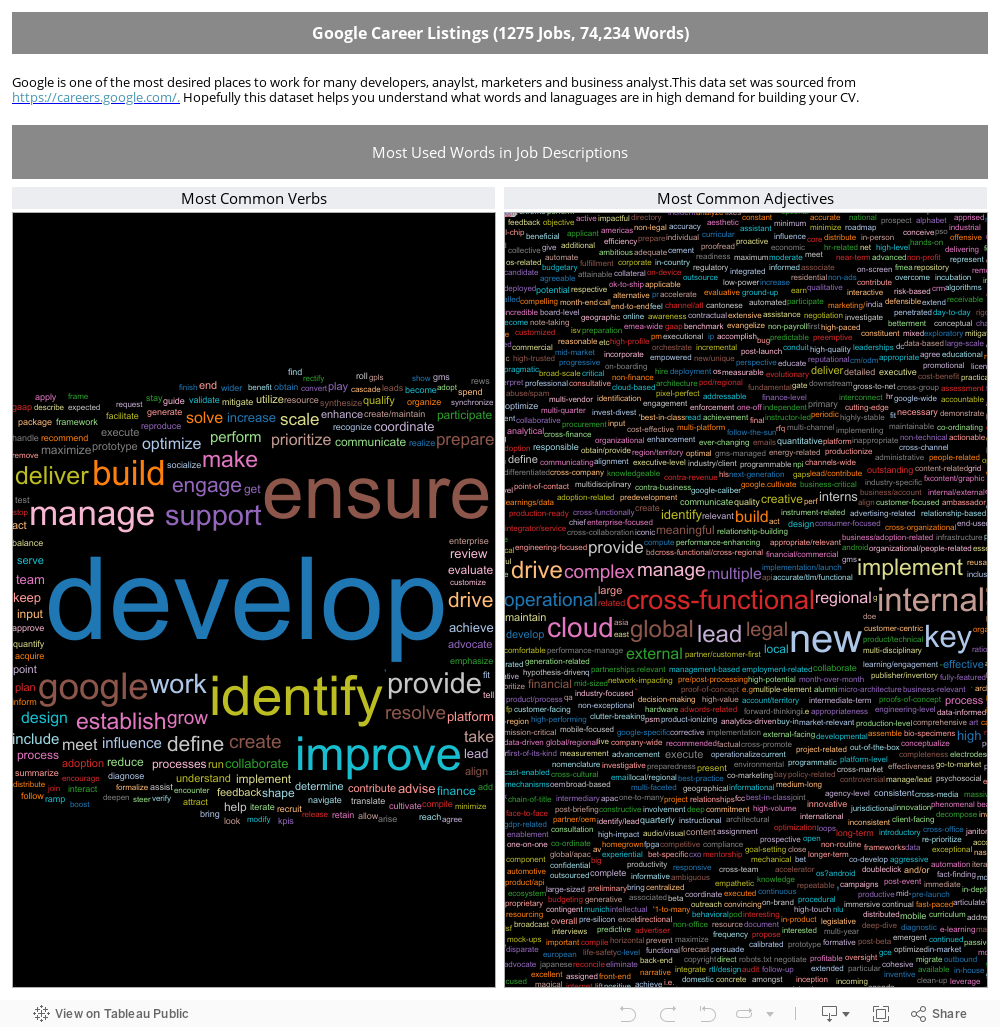
There common seperated files were piped into Tableau that to create thre visualizations. Two word clouds were created based on the word frequency for adjectives and verbs. Nouns were excluded due to the lack of significance across all the job descriptions.