Simpsons: Quality and Viewership Decline Trend
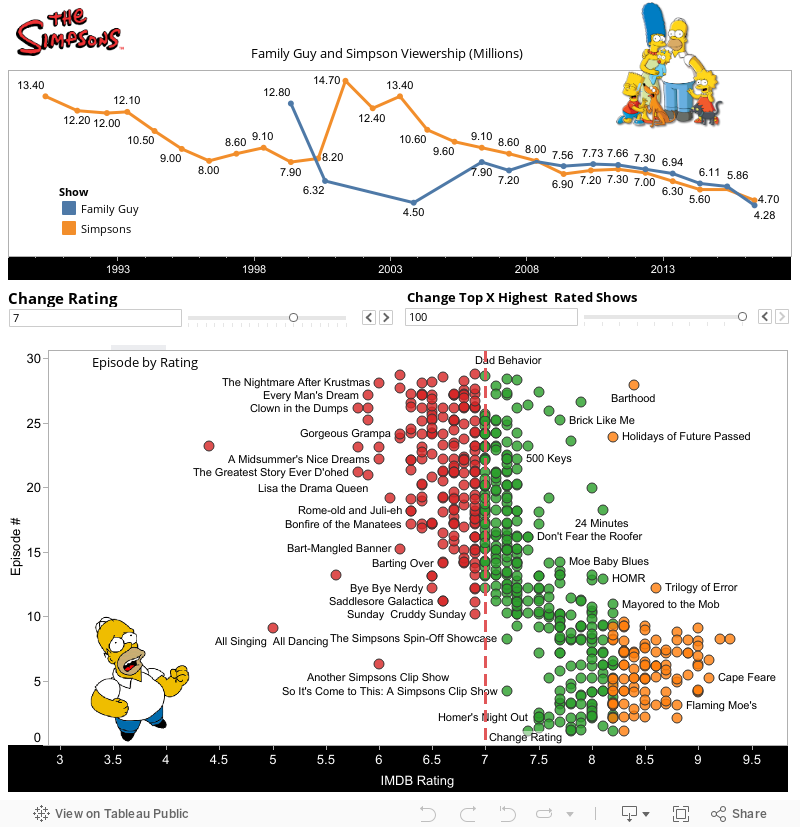
Like a very large segment of the world in the late 80s and early 90s. I was completely obsessed with the Simpsons. Every week, I would wait eagerly for each episodes to be release on FOX. I even bought the video games and other merchandise. But over time, the episodes became repetitive and less edgy. I am not sure when the show jump the shark. However, I have done some analysis to show how the show’s once stellar ratings and viewership have significantly dropped since it’s debut in 1989. Take a look at the visualization below and you can explore the data by hovering over the data points. Also you can alter the visualization by moving the parameters.
How I got the Data for the Viz
For the ratings. I used python web scraping code to pull the data into a CSV from the IMDB website. I cleaned the data up using some EXCEL techniques. For the data in regards to the viewership decline for both Family Guy and Simpsons, I used EXCEL Power Query to extract the data from tables. Both of these data sets were connected to Tableau for visualization purposes.
How I made this Viz
This was a simple visualization that only required 3 worksheets: the line graph, scatter plot and the dashboard. For the line graph, I appended both the Family Guy and Simpson viewership Data together. I used the Year in the and month in the dimension shelf. I added views in the measures shelf. I split the graph into two segments using the show dimension that I created to identify the Family Guy an Simpsons data. I made a parameter and set that allowed the colors to be manipulated depending on the TOP X rated shows and show rating cutoff.