Interactive Google Analytics Dashboards with Tableau 10
Here is a quick an easy way to create a dashboard using 4 sheets in Tableau
- Open a new project in Tableau 10
- Connect to Data Source
- Choose Google Analytics and apply your credentials.
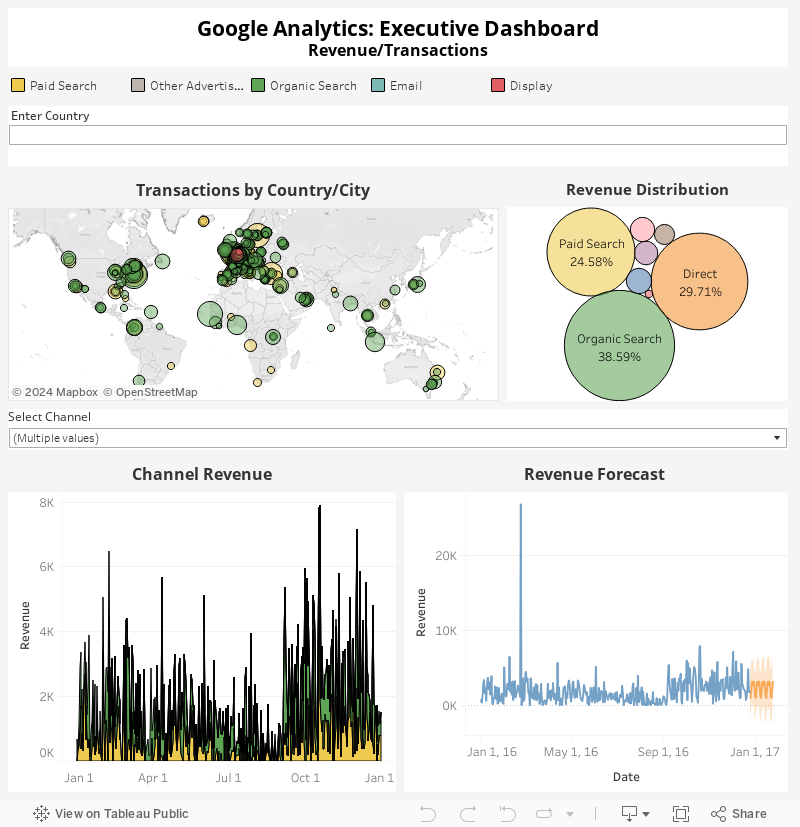
Define your Dimensions. For my Executive E-commerce Dashboard, I made sure to define the the elements that are in line with the business’s financial objectives. The dimension are channel, country, city, date The accompanying metrics are revenue and transactions. - Create 3 to 4 sheets with your desired visualizations. For this visualization: Provide a revenue by time chart to show trends and data. You can supercharge this by using forecasting options in Tableau. The more data points Tableau has the more accurate is at forecasting.

- Create a transactions by country and region. Go one step further by increasing the level of detail to city. You can add channels to colors shelf and revenue to size for more detail.

- Lastly, allow your user to manipulate the data using a filters. You can use the filter to apply to multiple visualizations changing the multiple graphs with one selection.


This is just so easy to implement. But I am facing one issue here.
After connecting to Google Analytics, my Revenue field is empty (0 actually). But, inside the GA homepage, I can see the Revenue data.
What could be the issue?