Google Store Most Installed Apps
The Google Apps store has a plethora of different apps ranging across a ton of different categories. Here is a visualization created in Tableau that give you an idea of what are the most popular apps on the platform.
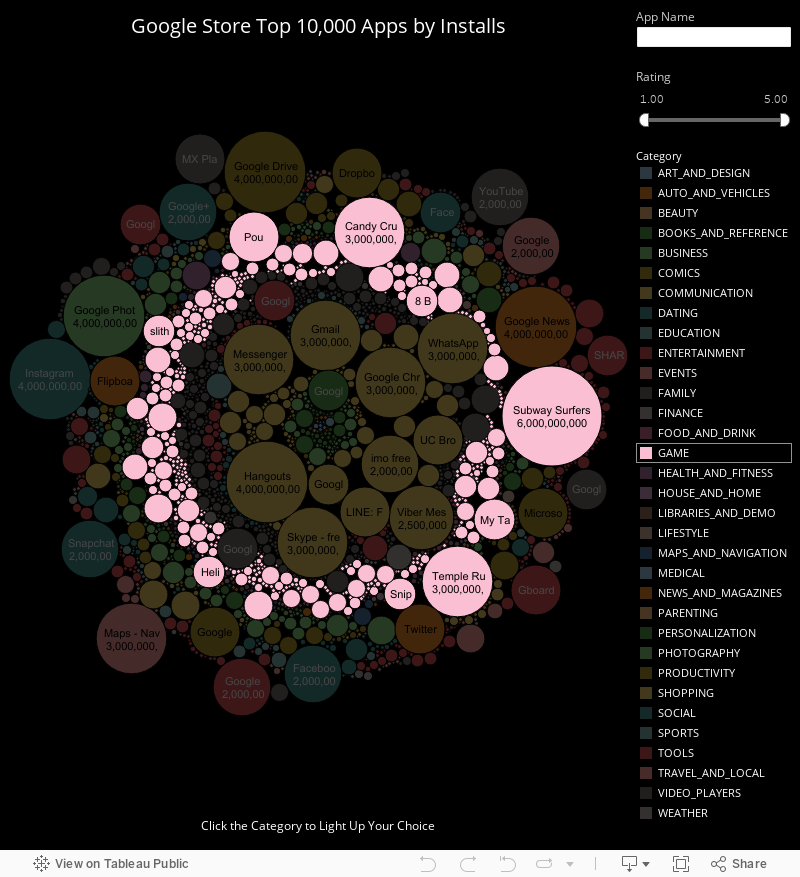
The dataset was sourced a Kaggle.com in the form a CSV. I did some light cleaning and preprocessing of the data using Python to drop columns and eliminate null values in specific areas like is rating and installs. This brought the number in the dataset down to around 10,214. This data was exported into a CSV and imported into Tableau.
This was a fairly easy visualization to put together because it consisted of essentially of one sheet that with a bubble chart. A filter was added to allow the user to use a slide to determine the rating from 1 to 5. This would lower the number the items in the bubble chart. Also, the category dimension was used to add a color legend. The standard Tableau 20 color graph was used.
The last filter that was incorporated used were app names with a wildcard filter.
For other visuals.
McDonalds Calorie Burn Calculator